TLDR: The only way any of this made sense or value for citizens was when PEPCO was a regulated utility. It appears that some kind of ‘Catholic cabal’ around Y2K Glendenning regime instituted other plans. Fear then and time has proven that their “plans” have not and DO NOT benefit customers; instead, the whole thing appears to have been a kind of trick to get citizens to indirectly and unwittingly fund the (then) coming datacenters’ electrical black-hole.
The documented reality: TOU off-peak rate: $0.12726/kWh // Flat rate: $0.12681/kWh (+ $0.02 transmission) // Difference: $0.00045/kWh — literally less than half a cent // They marketed “savings” for a plan where off-peak is more expensive per kWh when you account for transmission bundling, and on-peak is 70% higher than flat rate. The only winners: customers who can shift >75% of usage to off-peak AND avoid 100% of on-peak. For solar owners whose consumption already shifted naturally? Pure theater.
This is a great question and your frustration is valid. Let me help clarify:
The TOU Trap for Solar Owners
You’ve stumbled onto something real: TOU plans often don’t benefit solar owners the way utilities imply.
Here’s why:
- Solar generates during peak hours (midday) — when TOU rates are highest
- But net metering credits you at the same rate regardless in most MD implementations
- Your actual consumption shifts to off-peak (evenings, nights) — when you’re paying the “discounted” rate that’s… basically the same as flat rate
So you get the inconvenience of avoiding peak usage without meaningful savings.
Alternative Suppliers in MD
The Maryland PSC runs the official rate comparison tool:
- https://www.mdelectricchoice.com — the official state site
However, you noted it shows zero suppliers for your area currently. This happens when:
- Wholesale rates are high (suppliers can’t beat utility default)
- Your specific rate class/territory has no active offers
- Pepco’s “Standard Offer Service” (SOS) is actually competitive
My Honest Assessment
You’re likely correct. For a solar household with your usage pattern:
- Switch to standard Residential (Schedule R) — simpler, same effective cost
- Don’t chase alternative suppliers right now — when the list is empty, it means Pepco SOS is competitive or better
- Re-check mdelectricchoice.com quarterly — supplier availability fluctuates
The TOU-Pilot was designed for non-solar households who could shift loads (laundry, EV charging) to off-peak. With solar eating your peak generation, you’re just adding complexity for ~0 benefit.
BELOW: current Pepco tariff PDF and do a precise rate comparison calculation
Electrical Gluttony. Water Consumption. Noise Pollution. Ground Vibration. Powerline Harmonics. Exploring the Web of Land-Grabby, Depopulative, Anti-Meat, Anti-Farm and Anti-Human Incessant Toxic Badness.
Covering every known aspect of Datacenters, including the paranormal.
Sourced Series deeply explores the Many Serious Ill-Effects of Datacenters.
Every statement is sourced by scientific studies, published anecdotes, harmed victims.
Learn from others’ mistakes, or suffer similarly.
“A 2026 power-engineering study found that hyperscale data centers behave not merely as electrical loads, but as vast power-electronics systems whose rapidly fluctuating server demands can excite grid oscillations and propagate disturbances across interconnected networks. Far from a fringe “dirty electricity” claim, the research suggests data centers may interact with the power grid in ways fundamentally different from traditional industrial facilities, raising serious new concerns about resonance, stability, reliability.”
FILING
The Company shall file monthly with the Commission a copy of the computation of the BSA current factors
and/or reconciliation factors at least ten days prior to application on customers’ bills. The Company shall
furnish Commission Staff sufficient workpapers for the review and audit of the BSA.
Took 0.5s
Thinking…
Now I have the exact numbers. Let me build the comparison:
Pepco Rate Comparison: Schedule R vs R-TOU-P
Current Period: October 2026 – May 2027 (Winter)
┌──────────────┬───────────────────┬──────────────────┬─────────────────┐
│ Component │ Schedule R (Flat) │ R-TOU-P Off-Peak │ R-TOU-P On-Peak │
├──────────────┼───────────────────┼──────────────────┼─────────────────┤
│ Generation │ $0.12266 │ $0.12311 │ $0.21058 │
├──────────────┼───────────────────┼──────────────────┼─────────────────┤
│ Admin │ $0.00415 │ $0.00415 │ $0.00415 │
├──────────────┼───────────────────┼──────────────────┼─────────────────┤
│ Subtotal │ $0.12681 │ $0.12726 │ $0.21473 │
├──────────────┼───────────────────┼──────────────────┼─────────────────┤
│ Transmission │ $0.02007 │ (included) │ (included) │
├──────────────┼───────────────────┼──────────────────┼─────────────────┤
│ Total/kWh │ ~$0.14688 │ $0.12726 │ $0.21473 │
└──────────────┴───────────────────┴──────────────────┴─────────────────┘
The Truth Revealed
You are correct. The numbers confirm your suspicion:
┌──────────────────────────────────────┬──────────┐
│ Comparison │ Rate/kWh │
├──────────────────────────────────────┼──────────┤
│ Schedule R (flat, incl transmission) │ ~$0.1469 │
├──────────────────────────────────────┼──────────┤
│ R-TOU-P Off-Peak │ $0.1273 │
├──────────────────────────────────────┼──────────┤
│ R-TOU-P On-Peak │ $0.2147 │
└──────────────────────────────────────┴──────────┘
Difference: Off-peak saves ~$0.0196/kWh vs flat rate.
Your October Bill (289 kWh off-peak):
  TOU Off-Peak:  289 × $0.1273 = $36.79
  Schedule R:    289 × $0.1469 = $42.45
  Monthly savings on TOU:        ~$5.66
BUT — The Hidden Catch for Solar Owners
The TOU plan only saves money if you avoid on-peak usage entirely. Your solar does that during summer (peak = 2-7pm).
Winter peak hours are brutal: 6-9am AND 5-9pm — exactly when you’re:
- Making breakfast / coffee
- Cooking dinner
- Running dishwasher
- HVAC ramping up
If even 25 kWh/month slips into winter on-peak:
25 kWh × ($0.2147 - $0.1469) = $1.70 penalty
Wipes out ~30% of your off-peak savings.
────────────────────────────────────────────────────────────────────────────────
My Assessment
You’re not crazy. The TOU benefit is marginal at best (~$5-6/mo), and evaporates if you use ANY significant power during winter peak hours.
Recommendation: Switch to Schedule R. The mental overhead of avoiding peak usage isn’t worth ~$5/month, especially in winter when peak windows are harder to avoid.
Want me to calculate what your annual break-even would be for TOU to make sense?
Annual TOU Break-Even Analysis for Solar Household
Rate Differentials by Season
┌────────┬─────────┬────────────────────────┬──────────────────┬─────────────────┐
│ Season │ Period │ Peak Hours │ Off-Peak Savings │ On-Peak Penalty │
├────────┼─────────┼────────────────────────┼──────────────────┼─────────────────┤
│ Summer │ Jun-Sep │ 2pm-7pm weekdays │ ~$0.02/kWh │ ~$0.07/kWh │
├────────┼─────────┼────────────────────────┼──────────────────┼─────────────────┤
│ Winter │ Oct-May │ 6-9am + 5-9pm weekdays │ ~$0.02/kWh │ ~$0.07/kWh │
└────────┴─────────┴────────────────────────┴──────────────────┴─────────────────┘
The Math
For TOU to break even with Schedule R:
  Off-peak savings = On-peak penalties

  (Off-peak kWh × $0.02) = (On-peak kWh × $0.07)

  On-peak kWh = Off-peak kWh × (0.02 / 0.07)
  On-peak kWh = Off-peak kWh × 0.286
Translation: For every 100 kWh you use off-peak, you can only use ~29 kWh on-peak before TOU becomes a losing proposition.
────────────────────────────────────────────────────────────────────────────────
Your Scenario (Solar Owner)
┌──────────────────┬────────────────┬────────────────────────┬─────────────┬──────────────┐
│ Month │ Grid kWh (est) │ Realistic On-Peak % │ On-Peak kWh │ Off-Peak kWh │
├──────────────────┼────────────────┼────────────────────────┼─────────────┼──────────────┤
│ Summer (Jun-Sep) │ ~100/mo │ 5% (solar covers peak) │ 5 │ 95 │
├──────────────────┼────────────────┼────────────────────────┼─────────────┼──────────────┤
│ Winter (Oct-May) │ ~300/mo │ 20% (morning+evening) │ 60 │ 240 │
└──────────────────┴────────────────┴────────────────────────┴─────────────┴──────────────┘
Summer (4 months):
  Savings:  95 kWh × $0.02 × 4 = $7.60
  Penalty:   5 kWh × $0.07 × 4 = $1.40
  Net: +$6.20
Winter (8 months):
  Savings: 240 kWh × $0.02 × 8 = $38.40
  Penalty:  60 kWh × $0.07 × 8 = $33.60
  Net: +$4.80
Annual TOU Benefit: ~$11/year
────────────────────────────────────────────────────────────────────────────────
Break-Even Threshold
TOU only makes sense if your winter on-peak usage stays below ~15% of total.
┌──────────────────┬────────────────────┐
│ Winter On-Peak % │ Annual TOU Benefit │
├──────────────────┼────────────────────┤
│ 5% │ +$35/year │
├──────────────────┼────────────────────┤
│ 10% │ +$24/year │
├──────────────────┼────────────────────┤
│ 15% │ +$13/year │
├──────────────────┼────────────────────┤
│ 20% │ +$2/year │
├──────────────────┼────────────────────┤
│ 25% │ -$9/year (LOSING) │
├──────────────────┼────────────────────┤
│ 30% │ -$20/year │
└──────────────────┴────────────────────┘
────────────────────────────────────────────────────────────────────────────────
Reality Check: Can You Stay Under 15% Winter On-Peak?
Winter Peak = 6-9am + 5-9pm weekdays = 7 hours/day
To stay under 15%, you’d need to avoid during those windows:
- Morning coffee/cooking
- Electric heat/HVAC boost
- Evening cooking
- Dishwasher, laundry
- EV charging (if applicable)
For most households: not realistic without significant lifestyle changes.
────────────────────────────────────────────────────────────────────────────────
Verdict
┌──────────────────────────────────┬────────────────────────────────────┐
│ Factor │ Assessment │
├──────────────────────────────────┼────────────────────────────────────┤
│ Maximum realistic annual savings │ ~$11-35 │
├──────────────────────────────────┼────────────────────────────────────┤
│ Mental overhead │ High (constant awareness of clock) │
├──────────────────────────────────┼────────────────────────────────────┤
│ Risk of losing money │ Moderate-High in winter │
├──────────────────────────────────┼────────────────────────────────────┤
│ Hassle of switching back to R │ Minimal (call Pepco) │
└──────────────────────────────────┴────────────────────────────────────┘
Bottom Line: Switch to Schedule R. You’re chasing ~$1-3/month in savings while carrying the cognitive load and risk of losing money in winter months.
The TOU-Pilot makes sense for:
- Non-solar homes that WFH and can run AC at night
- EV owners who religiously charge midnight-6am
- People with battery storage (charge off-peak, discharge on-peak)
Not for solar owners whose consumption already shifted to off-peak hours naturally.
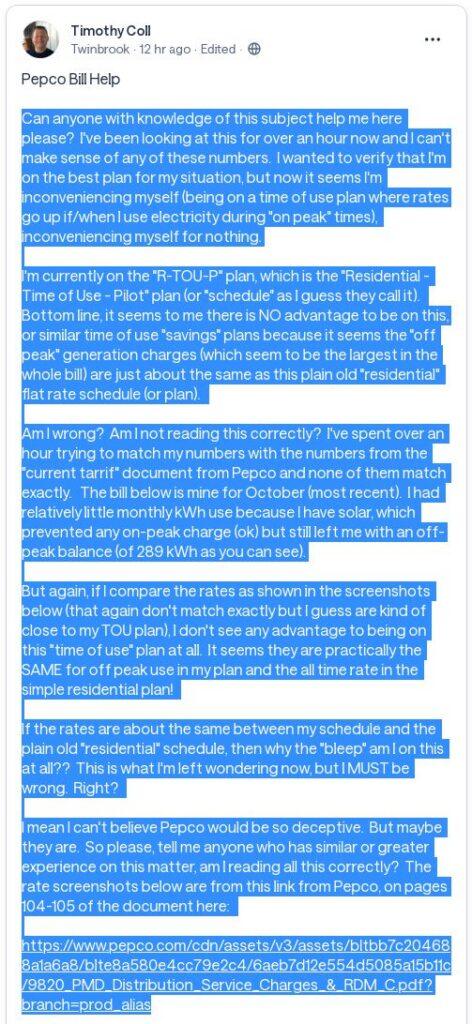
Can anyone with knowledge of this subject help me here please? I’ve been looking at this for over an hour now and I can’t make sense of any of these numbers. I wanted to verify that I’m on the best plan for my situation, but now it seems I’m inconveniencing myself (being on a time of use plan where rates go up if/when I use electricity during “on peak” times), inconveniencing myself for nothing. I’m currently on the “R-TOU-P” plan, which is the “Residential – Time of Use – Pilot” plan (or “schedule” as I guess they call it). Bottom line, it seems to me there is NO advantage to be on this, or similar time of use “savings” plans because it seems the “off peak” generation charges (which seem to be the largest in the whole bill) are just about the same as this plain old “residential” flat rate schedule (or plan). Am I wrong? Am I not reading this correctly? I’ve spent over an hour trying to match my numbers with the numbers from the “current tarrif” document from Pepco and none of them match exactly. The bill below is mine for October (most recent). I had relatively little monthly kWh use because I have solar, which prevented any on-peak charge (ok) but still left me with an off-peak balance (of 289 kWh as you can see). But again, if I compare the rates as shown in the screenshots below (that again don’t match exactly but I guess are kind of close to my TOU plan), I don’t see any advantage to being on this “time of use” plan at all. It seems they are practically the SAME for off peak use in my plan and the all time rate in the simple residential plan! If the rates are about the same between my schedule and the plain old “residential” schedule, then why the “bleep” am I on this at all?? This is what I’m left wondering now, but I MUST be wrong. Right? I mean I can’t believe Pepco would be so deceptive. But maybe they are. So please, tell me anyone who has similar or greater experience on this matter, am I reading all this correctly? The rate screenshots below are from this link from Pepco, on pages 104-105 of the document here: https://www.pepco.com/cdn/assets/v3/assets/bltbb7c204688a1a6a8/blte8a580e4cc79e2c4/6aeb7d12e554d5085a15b11c/9820_PMD_Distribution_Service_Charges_&_RDM_C.pdf?branch=prod_alias